
As a digital marketer you constantly need to generate reports from Google Adwords for clients. Microsoft Excel is pretty much the industry standard for generating these reports and doing all your analytical number crunching. I have been using Excel for many years and today I wanted to share a few tips and tricks that you should be leveraging when using Excel.
Leverage Pivot Tables
When you download an Adwords performance report for a week you are presented with a csv file containing raw data and headings. Using pivot table you can create an interactive chart that clients can play around with to make more sense of the data. In fact, you can even use the pivot table to do live presentations in front of clients.
- Select All The Data In The Sheet
- Go To Insert > Pivot Table
- You will be greeted with an interface where you can arrange the table.
- Add all the metrics like impressions, clicks etc. under the values tab and the ad-groups as rows. You can also use various campaigns as top level filters.
- Click OK and you have a fully interactive pivot table.
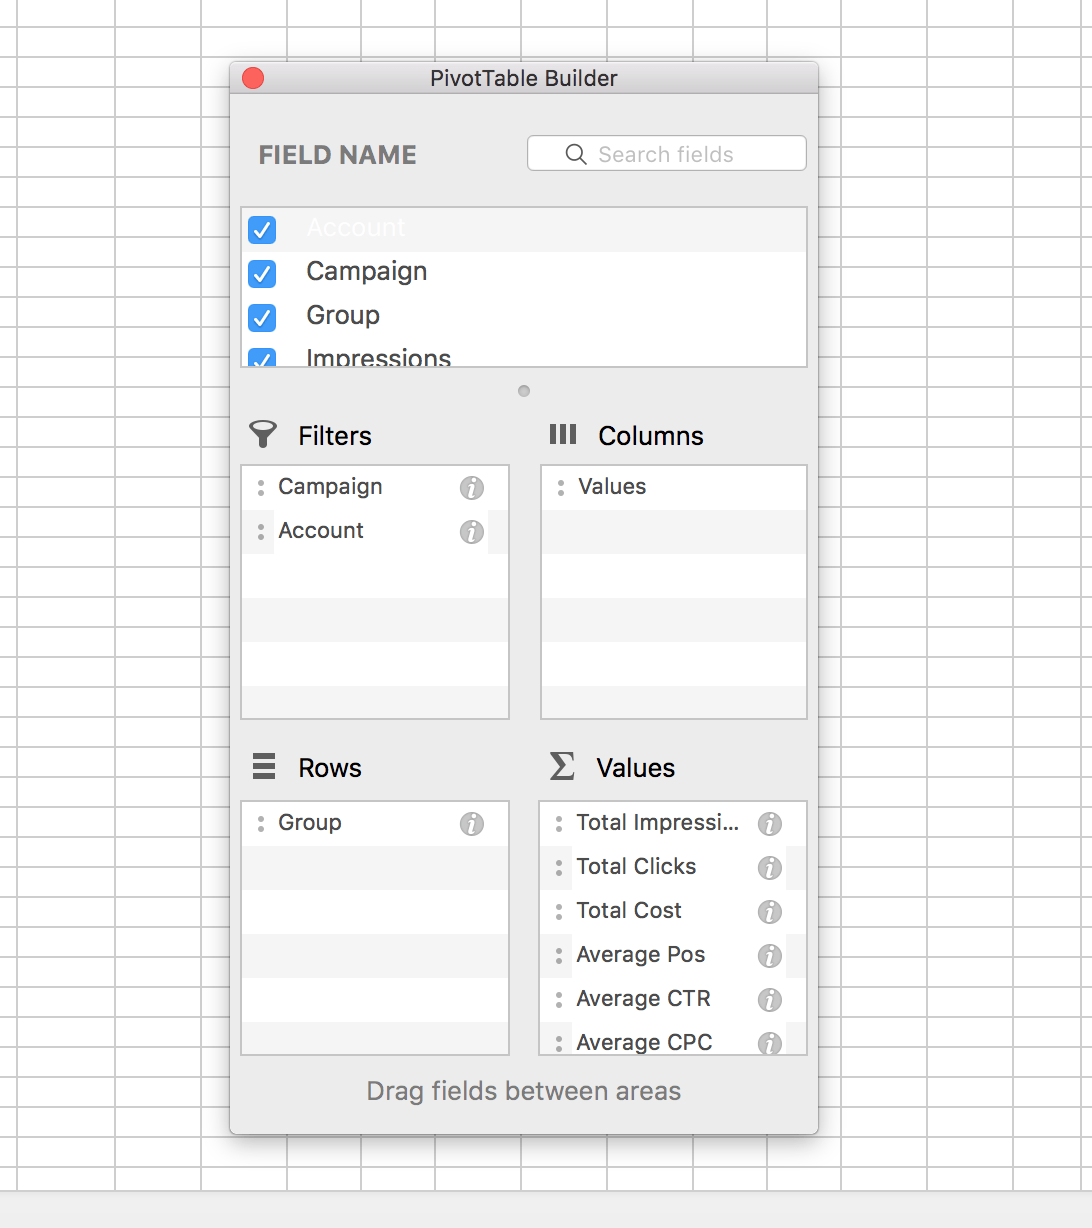
Important Note: Make sure you change the values of CPC & position to average by right clicking the column header & selecting “Field Settings” and then choosing average instead of sum.
Use Custom Reports To Present To Clients
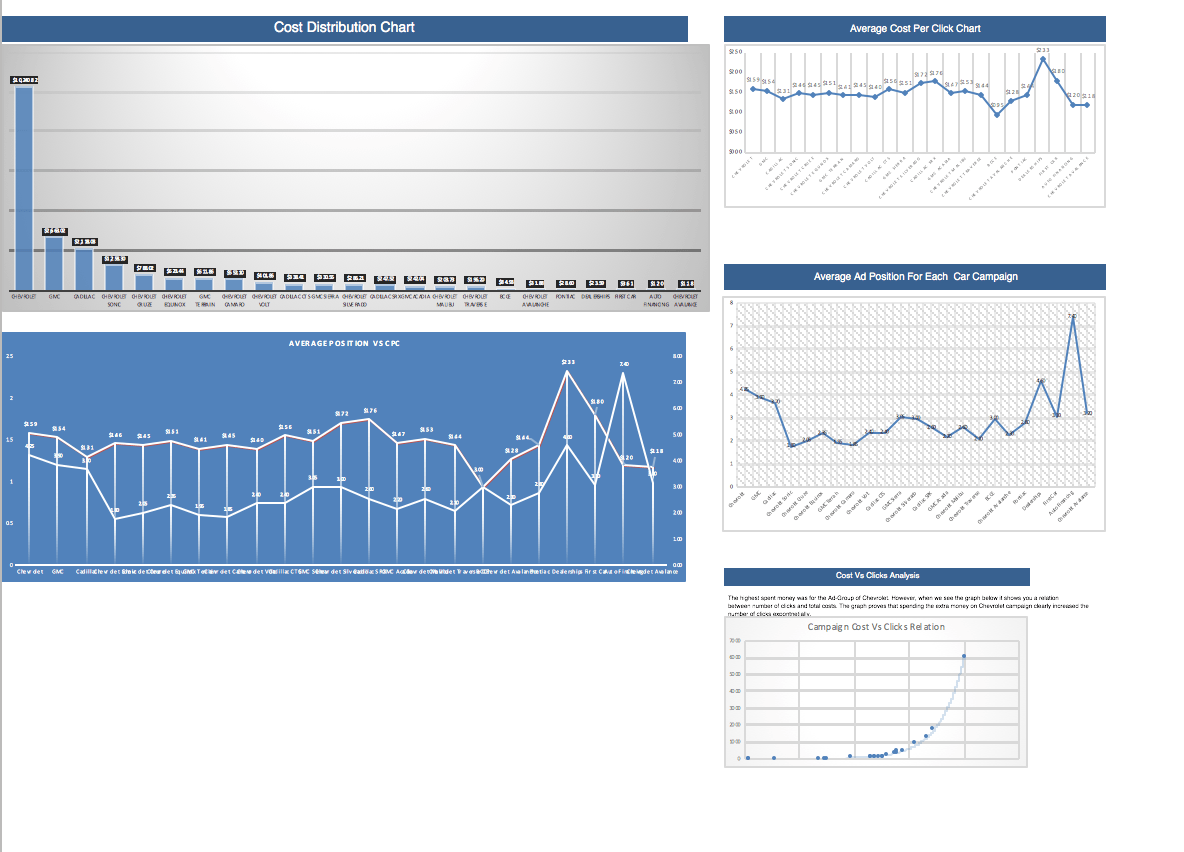
Excel has lots of built in templates for generating reports and you can harness the power of excel reports editor to create customized charts for your Adwords performance. You may be wondering why do we need to generate charts in the first place? Adwords provide you with their own version of reports but when you download the raw data as a csv file you can showcase your campaign from different perspectives like on a pie chart, scatter diagram etc. to obtain a deeper understanding about how the ad-groups or keywords are performing.
Save Excel Reports As Templates
One handy feature inside excel is the ability to setup any excel file as a template. Instead of doing everything from scratch make sure you save a master template so that you can reuse the layout every time you are generating a report. Go To File > Save As Template to convert any workbook into a template format.
Use Filters For Report Data
This is a really handy feature that many people never use and can help improve how your clients view raw data. Select the entire block or rows and columns (including the heading row) and go to Data > Click The Filter Button.
This will allow you to convert the table into a filterable data allowing you to arrange things easily. You can choose how to sort everything from the filter options panel. Once you successfully set up filters the top row will have small arrows beside them. When you click on the arrows you are greeted with filter options for each column and the whole table changes accordingly.


0 Comments